Difference between revisions of "Hardware:SourceCode"
| Line 17: | Line 17: | ||
The FID GUI lets students acquire a free induction decay and see the Fourier transform (lineshape). The GUI also lets students run a flip angle calibration to find the 90 deg and 180 deg RF pulses amplitudes. The shim can be set either using the "auto shim" tool or by hand using the slider bars or text fields. | The FID GUI lets students acquire a free induction decay and see the Fourier transform (lineshape). The GUI also lets students run a flip angle calibration to find the 90 deg and 180 deg RF pulses amplitudes. The shim can be set either using the "auto shim" tool or by hand using the slider bars or text fields. | ||
| + | |||
| + | |||
| + | |||
| Line 46: | Line 49: | ||
[[File:SE_PROJ_GUI_projection_multitube.png|600px|thumb|right|SE_PROJ_GUI]] | [[File:SE_PROJ_GUI_projection_multitube.png|600px|thumb|right|SE_PROJ_GUI]] | ||
| + | |||
| + | |||
| + | |||
| + | |||
| Line 74: | Line 81: | ||
IMAGING_GUI_1 lets students acquire a 2D spin echo image (no slice-direction encoding). Students must set the maximum gradient amplitude for the readout and phase encoding gradients in order to achieve the desired FOV. The GUI displays the acquired k-space data. Students then process k-space offline with the FFT to create the image. | IMAGING_GUI_1 lets students acquire a 2D spin echo image (no slice-direction encoding). Students must set the maximum gradient amplitude for the readout and phase encoding gradients in order to achieve the desired FOV. The GUI displays the acquired k-space data. Students then process k-space offline with the FFT to create the image. | ||
| + | |||
| + | |||
| + | |||
| Line 100: | Line 110: | ||
For spin echo acquisitions, the GUI displays each readout and projection (FFT'ed readout) in real time while updating the 2-D k-space figure and corresponding image. The partial images are computed from a zero-padded k-space matrix. This illustrates how high frequency components near the edge of k-space provide edges and details while the central lines of k-space provide most of the signal and contrast in the image. | For spin echo acquisitions, the GUI displays each readout and projection (FFT'ed readout) in real time while updating the 2-D k-space figure and corresponding image. The partial images are computed from a zero-padded k-space matrix. This illustrates how high frequency components near the edge of k-space provide edges and details while the central lines of k-space provide most of the signal and contrast in the image. | ||
| + | |||
| + | |||
| + | |||
| Line 120: | Line 133: | ||
IMAGING_GUI_3 acquires 3-D turbo spin echo images and displays the results in a separate window. | IMAGING_GUI_3 acquires 3-D turbo spin echo images and displays the results in a separate window. | ||
| + | |||
| + | |||
| + | |||
Revision as of 11:06, 23 August 2013
Click here to download Matlab GUI files for running the labs used in MIT 6.S02.
Description of GUIs
The GUIs let students acquire data, view the Fourier transform of the data on-screen, vary basic pulse sequence parameters (such as TE and TR), and save the raw data to a Matlab .mat file.
FID_GUI
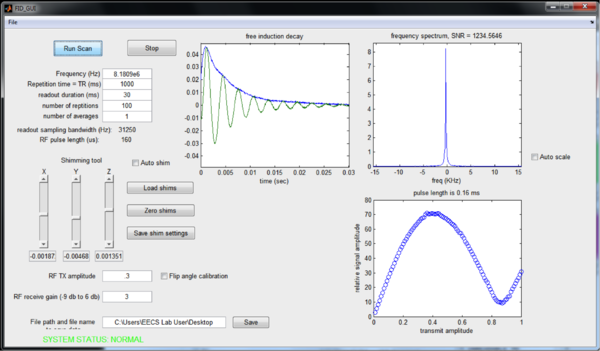
The FID GUI lets students acquire a free induction decay and see the Fourier transform (lineshape). The GUI also lets students run a flip angle calibration to find the 90 deg and 180 deg RF pulses amplitudes. The shim can be set either using the "auto shim" tool or by hand using the slider bars or text fields.
SE_PROJ_GUI
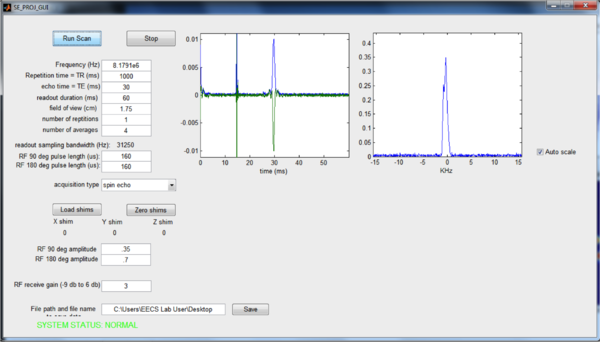
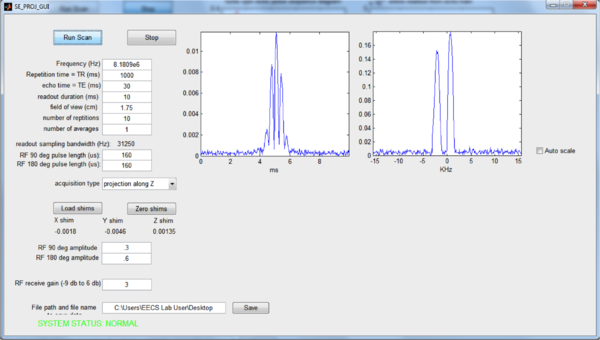
The spin echo/projection GUI shows the evolution of the spins in a two-pulse experiment with and without dephase/rephase gradient lobes. Students can see the effect of shimming on the shape of the spin echo. They can also see how applying gradient lobes along each direction creates a 1-D projection of the object instead of a narrow lineshape.
IMAGING_GUI_1
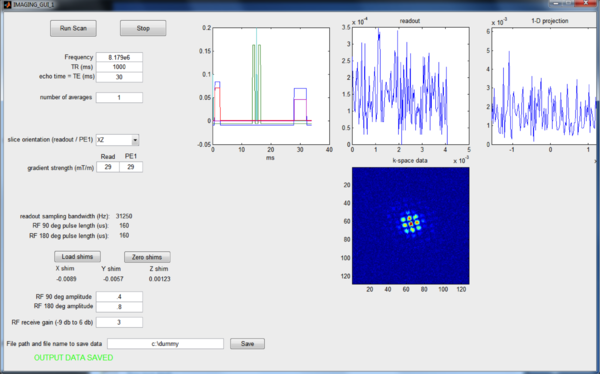
IMAGING_GUI_1 lets students acquire a 2D spin echo image (no slice-direction encoding). Students must set the maximum gradient amplitude for the readout and phase encoding gradients in order to achieve the desired FOV. The GUI displays the acquired k-space data. Students then process k-space offline with the FFT to create the image.
IMAGING_GUI_2
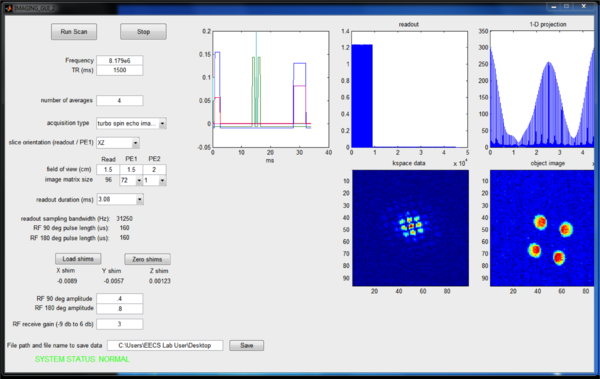
IMAGING_GUI_2 automatically computes read and phase encoding amplitudes for a desired FOV and resolution. Students can acquire 2-D spin echo and turbo spin echo (RARE) data and view the resulting images inside the GUI.
The upper left plot shows the pulse sequence being played by the scanner.
For spin echo acquisitions, the GUI displays each readout and projection (FFT'ed readout) in real time while updating the 2-D k-space figure and corresponding image. The partial images are computed from a zero-padded k-space matrix. This illustrates how high frequency components near the edge of k-space provide edges and details while the central lines of k-space provide most of the signal and contrast in the image.
IMAGING_GUI_3
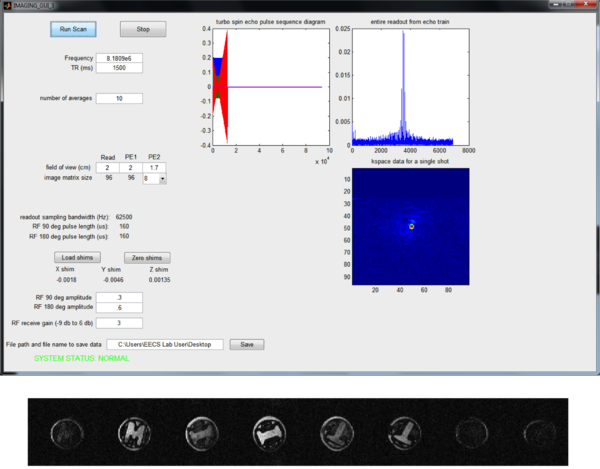
IMAGING_GUI_3 acquires 3-D turbo spin echo images and displays the results in a separate window.
PAST BUG FIXES / REVISIONS
PENDING BUG FIXES / REVISIONS
- create a launchpad with buttons for quickly opening all of the GUIs
- allow user to use "stop" button during auto-shimming
- add gradient echo sequence (FLASH)
- add slice-select pulse sequence
- clean up any remaining timing errors in spin echo and RARE sequences
